Conclusion
June 10, 2024Many aspects of my process were long and seemed never-ending, with most of the time spent on data management and coding. These are elements that people who view my work don’t see or feel. In some ways this is frustrating. However, I am immensely grateful that I had to find so many solutions and take so many turns to get where I wanted to go. These sidetracks have taught me a lot about how to deal with future problems and to discover new approaches that will hopefully save me from taking similar detours next time.
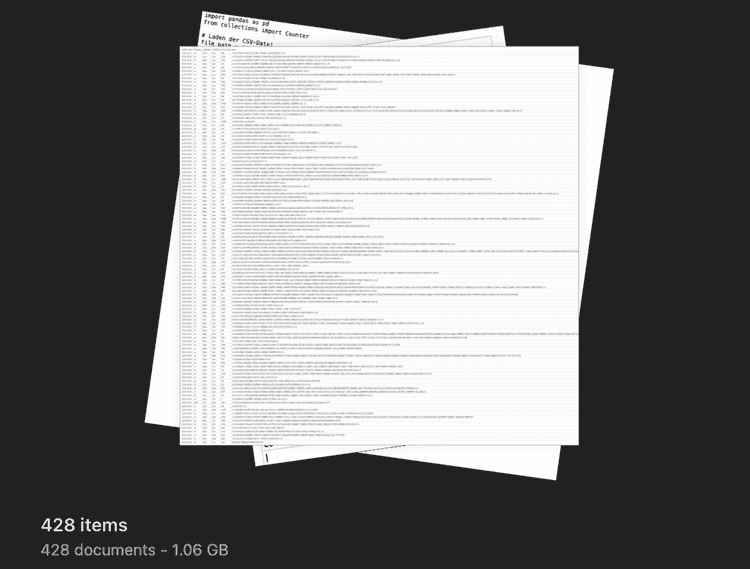
For all the trial and error I went through, his project involved 428 sets of data with different kinds of paths that I took to get to where I wanted to be.
I learned a lot about both coding and data analysis. I became more proficient in Excel, p5.js, d3.js, HTML, CSS and React. I also got my first taste of NLP. In terms of visualisation and UX, my mistakes were valuable learning experiences.
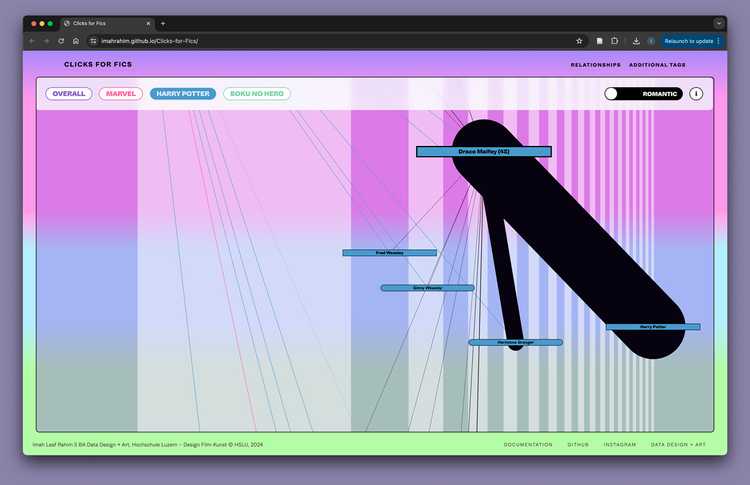
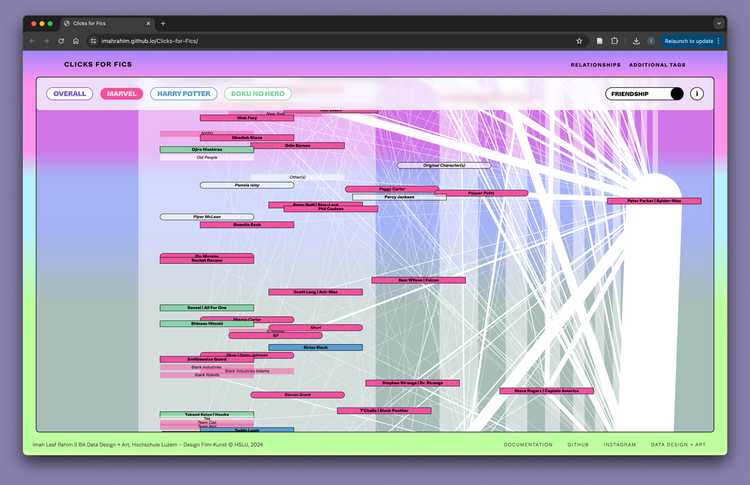
I ventured into network data visualisation for the first time, which was a new and valuable adventure. I learned how important it is to identify relevant data dimensions, and how important arrangement and colour schemes are in supporting a particular message.
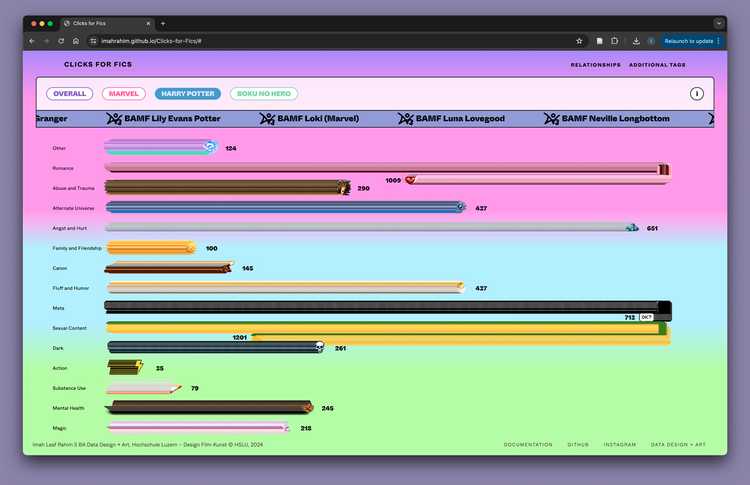
With my additional tags, I took a significant detour only to end up with a bar chart. However, this journey was essential for me to experience, as I don’t think I would have arrived at the current solution without it.
Key Takeaways
-
Data and Coding:
- The extensive time spent on data cleaning and coding underscored the importance of these foundational elements. Even though these aspects are not immediately visible in the final product, they are crucial for creating a functional and accurate visualization.
-
Problem-Solving and Flexibility:
- The numerous challenges and detours I encountered forced me to develop my problem-solving skills and remain flexible in my approach. These experiences have equipped me with a toolkit of strategies for tackling similar issues in future projects.
-
Tool Proficiency:
- Through this project, I have significantly improved my proficiency with various tools and technologies, including Excel, p5.js, d3.js, HTML, CSS, React, and NLP. These skills will be invaluable for future data visualization and analysis projects.
-
Importance of Design and UX:
- My exploration into network visualization and UX design taught me the importance of thoughtful design and user experience. The arrangement and color scheme of visual elements are critical for conveying the intended message and enhancing user understanding.
-
Iterative Process:
- The iterative nature of my project, especially with the additional tags, highlighted the importance of trial and error. Each iteration brought new insights and led to more refined solutions.
-
Realizing the Value of Detours:
- Although the mistakes were time-consuming, they were also informative. Each misstep and correction provided deeper insights into the data and the most effective ways to visualize it.
Final Thoughts
Reflecting on this project, I am proud of the progress I made and the knowledge I gained. Despite the frustrations and setbacks, the journey was incredibly educational. I now feel more prepared to handle complex data visualization projects and more confident in my ability to find creative solutions to challenging problems.
I hope that my work provides a meaningful contribution to the AO3 community and inspires others to explore the fascinating world of data visualization.
