Data Analysis
April 14, 2024Overview
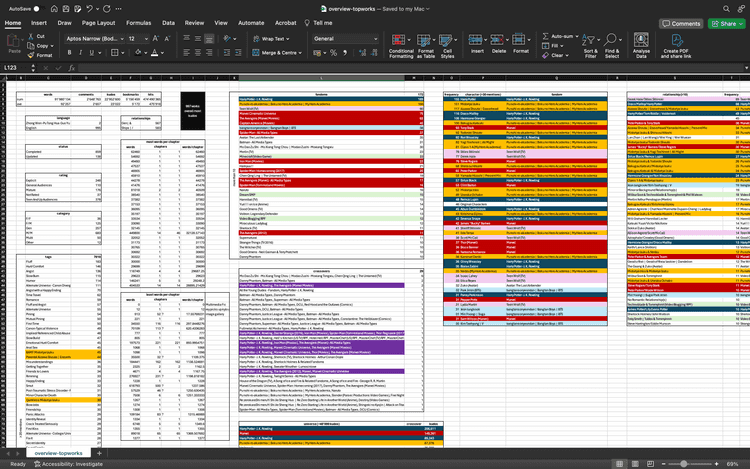
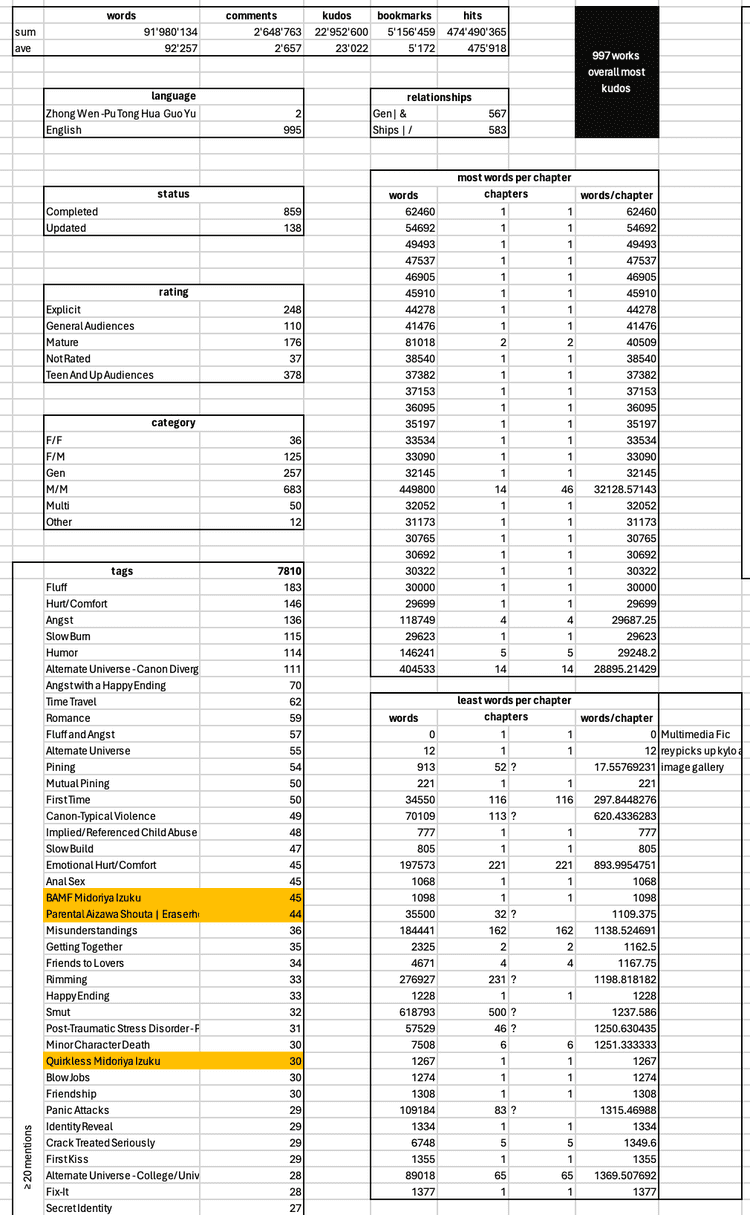
After scraping all my data, I initially explored some tags in Excel to see what insights I could uncover and what conclusions I could draw from this data.
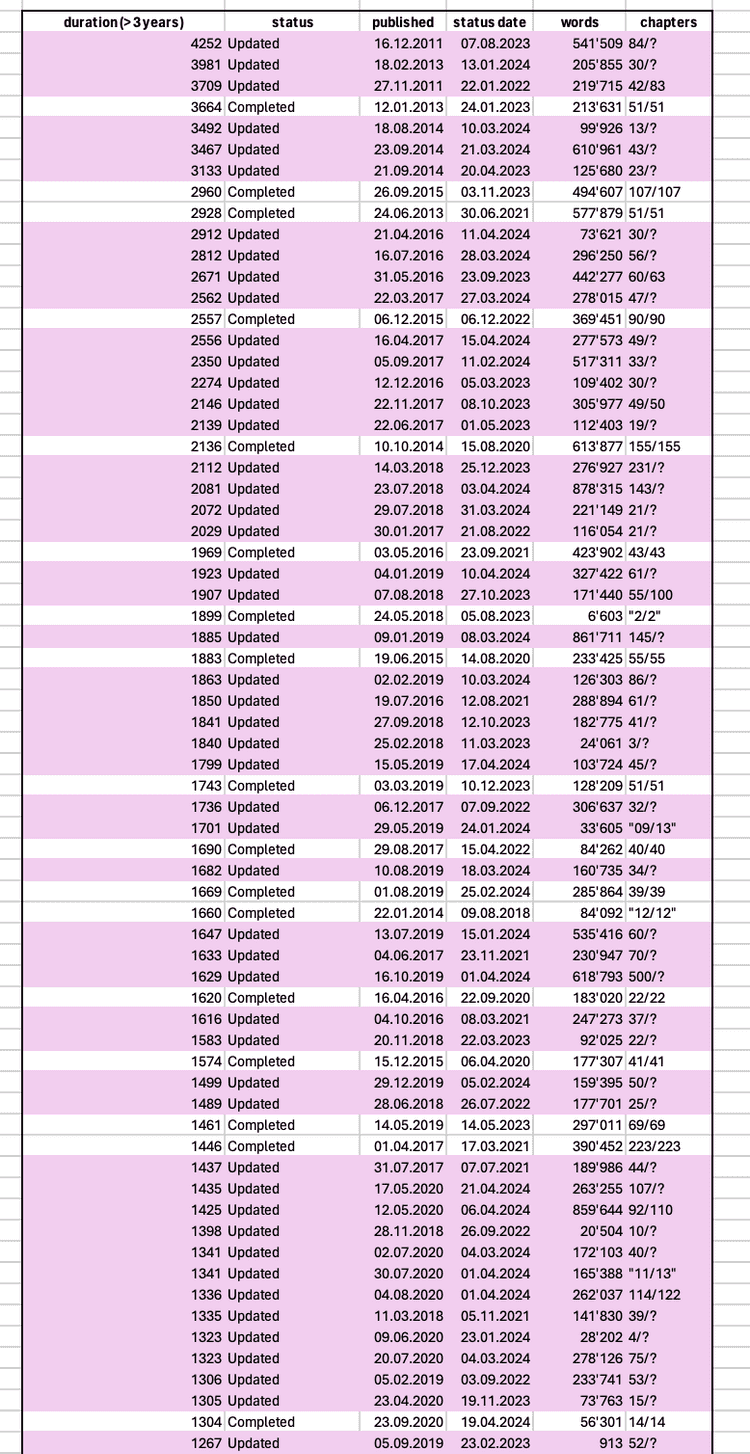
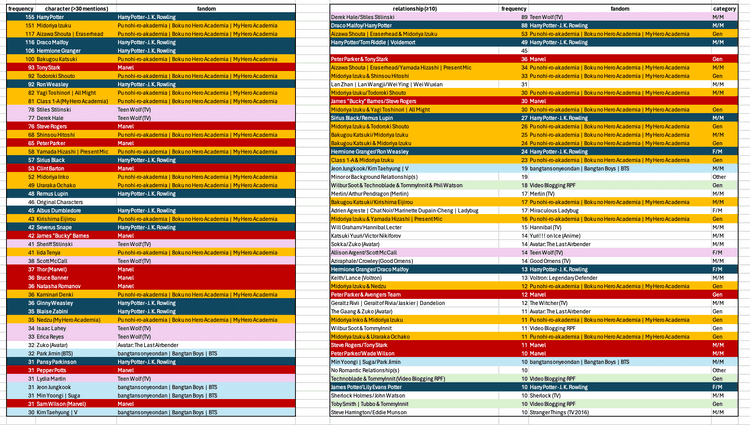
I attempted to create an overview of my dataset by calculating, categorizing, and reorganizing the data.
How the distribution of tags is, how the distribution of Kudos and chapter length is, and what the average words per chapter are, how frequently certain categories, fandoms, and characters appear. However, since I’m still an Excel novice and didn’t know how to best dissect the data dimensions:
- fandom: Harry Potter - J. K. Rowling
- relationship: Sirius Black/Remus Lupin, Sirius Black & Remus Lupin, James Potter/Lily Evans Potter
- character: Remus Lupin, Sirius Black, James Potter, Lily Evans Potter, Peter Pettigrew, Severus Snape, Minerva McGonagall, Bellatrix Black Lestrange, Narcissa Black Malfoy, Albus Dumbledore, Mulciber Sr. (Harry Potter), Horace Slughorn, Mary Macdonald, Marlene McKinnon, Poppy Pomfrey, Walburga Black, Regulus Black, Fenrir Greyback
- additional tags: Marauders’ Era, Marauders, Marauders Friendship, wolfstar, Get Together, Slow Burn, so slow, it’s slow, seriously, Complete, Canon Compliant, Angst, Fluff, Fluff and Angst, Requited Love, Canonical Character Death, First War with Voldemort, First Kiss, Period Typical Attitudes
To determine the frequency of these elements, I sought help from ChatGPT to write a Python script that could automatically extract and calculate this information.
import pandas as pd

# Read the Excel file
df = pd.read_excel("topworks.xls")

# Replace NaN values with an empty string
df["additional tags"] = df["additional tags"].fillna("")

# Split tags by any separator (comma, semicolon, newline, tab, etc.)
tags_split = df["additional tags"].str.split(r'[,.;\n\t]+')

# Flatten the list of lists into a single list of tags
all_tags = [tag for sublist in tags_split for tag in sublist]

# Remove leading and trailing spaces from tags
all_tags = [tag.strip() for tag in all_tags]

# Create a Series from the flattened list of tags
tag_series = pd.Series(all_tags)

# Get value counts to count the frequency of each tag
tag_freq = tag_series.value_counts().reset_index()
tag_freq.columns = ['Tag', 'Frequency']

# Save the DataFrame to an Excel file
tag_freq.to_excel("tag_frequency.xlsx", index=False)
After running this script, I gained a clear picture of what fascinated me the most about this data and which aspects I wanted to delve deeper into.
Focus
- Fandoms
- Ships
- Characters
- Additional Tags
These overviews provided me with a good insight into the data and gave me a much better understanding of what I was working with. However, I soon realized that the data is not easy to analyze across multiple columns. When separating data into fandoms, characters, relationships, and tags to examine them individually, it becomes challenging to connect these elements back to other dimensions. Additionally, there are numerous individual data layers that are not easy to clean. This eventually led to most of my time being spent on cleaning the datasets.
These data points provide the most insight into what users on AO3 enjoy writing and reading about.


